
Archived Content
Information identified as archived is provided for reference, research or recordkeeping purposes. It is not subject to the Government of Canada Web Standards and has not been altered or updated since it was archived. Please contact us to request a format other than those available.
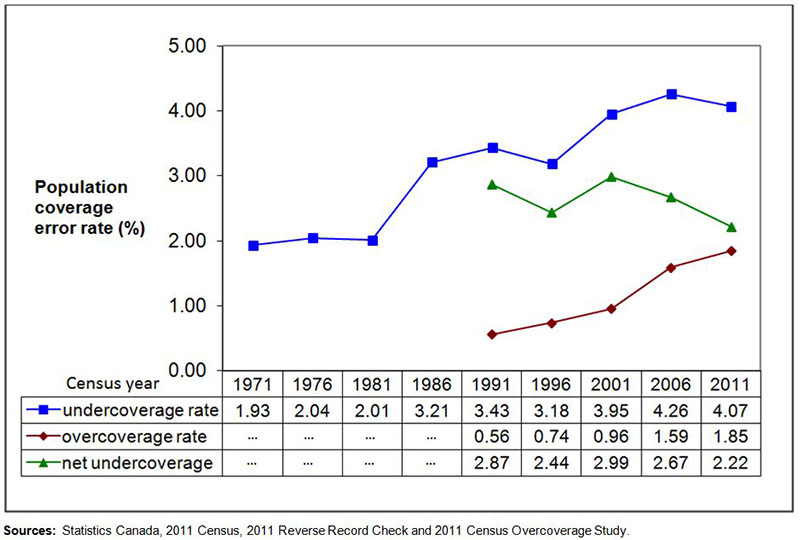
Chart 11.1
Estimated rates of population coverage error for Canada, 1971 Census to 2011 Census
Description of Chart 11.1
Long description:
The title of the chart is: Estimated rates of population coverage error for Canada, 1971 to 2011 censuses.
This is a line chart with markers. The years (censuses) are on the horizontal axis and the values on the vertical axis.
There are three lines in this chart.
The vertical axis is labelled 'Population coverage error rate (%).'
The horizontal axis is labelled 'Census year' and includes the 1971, 1976, 1981, 1986, 1991, 1996, 2001, 2006 and 2011 censuses.
The first line presents undercoverage. The values are as follows: 1.93%, 2.04%, 2.01%, 3.21%, 3.43%, 3.18%, 3.95%, 4.26% and 4.07%.
The second line presents overcoverage and begins at the 1991 Census. The values are as follows: 0.56%, 0.74%, 0.96%, 1.59% and 1.85%.
The third line presents net undercoverage and also begins at the 1991 Census. The values are as follows: 2.87%, 2.44%, 2.99%, 2.67% and 2.22%.
Sources: Statistics Canada, 2011 Census, 2011 Reverse Record Check and 2011 Census Overcoverage Study.
- Date modified: