
Archived Content
Information identified as archived is provided for reference, research or recordkeeping purposes. It is not subject to the Government of Canada Web Standards and has not been altered or updated since it was archived. Please contact us to request a format other than those available.
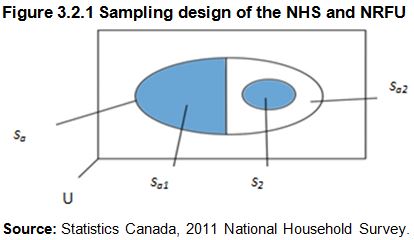
Figure 3.2.1
Sampling design of the NHS and NRFU
Description of Figure 3.2.1
Long description:
Figure 3.2.1 illustrates the NHS and NRFU sampling design.
The U rectangle represents the census dwellings.
The NHS sample is shown by the large ellipse sa.
The left portion of the large ellipse (darker colour) is sa1. It represents the dwellings that had already responded to the NHS by July 14, 2011.
The right portion of the large ellipse, sa2, represents dwellings that had not responded by that date.
The subsample of non-respondents for NRFU is represented by the small oval s2 and the non respondents not selected for NRFU are in sa2.
Source: Statistics Canada, 2011 National Household Survey.
- Date modified: